A chart of colours, and a drawing that names places in it
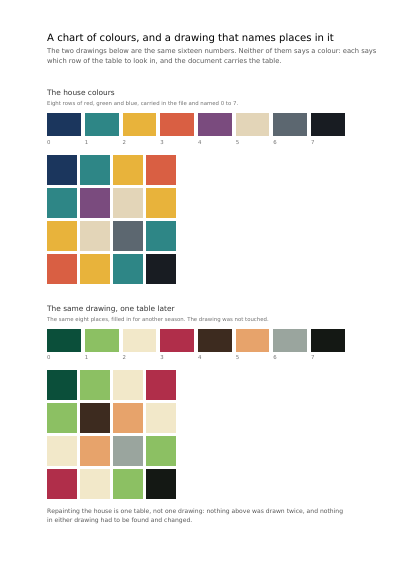
A chart of house colours the file carries, and a drawing whose sixteen numbers are places in that chart rather than colours. The same drawing is shown twice through two charts: repainting a whole brand is one table, not every drawing.
In an indexed space a colour is one number, and that number is not a colour: it is the row of a table the document carries. This page shows a chart of house colours, and a drawing whose sixteen numbers are places in that chart rather than colours of their own.
The same drawing is then shown a second time through a second chart, and everything about it changes. That is the argument for the space in one picture: when a brand repaints itself, what changes is one table, not every drawing that ever used the old colours.
What this example shows
- A palette carried in the file, and drawings that point into it.
- One drawing shown through two palettes, unchanged itself.
- One byte per colour rather than three or four.
The code, in full
The same document is written twice, once in each language. Both files are shown in full, with the code coloured on the server, and can be copied in one click.
The document itself
The same document is written in each of these languages. Open the one you want to look at.
Open the document in English
Open the document in French
Read the Rust source
Read the Python source